New from the Institute: Embedded Recruiting & Hiring Benchmarks
Recruiting & Hiring By Elizabeth Combs, Managing Director, Frontline Research & Learning Institute on 2/13/2019
The Frontline Research & Learning Institute was founded with one goal: to provide data-driven research, resources and observations to support and advance the educational community. With data from over 7,500 K-12 organizations and millions of users, we want to put these insights directly at our clients’ fingertips — and make them actionable.
We’ve already done this with the Institute Report in Absence & Substitute Management, where we infuse anonymized, aggregate data directly into the system as embedded benchmarks. Now, with the release of an all-new Institute Report in Frontline Recruiting & Hiring, our clients can benchmark their hiring data against national, state and regional norms. The report is based on data used with permission from over 1,300 education organizations (including public school districts, educational service agencies, and charter & private schools) using Frontline’s applicant tracking system.
Selected Key Performance Indicators (KPIs) in the Frontline Recruiting & Hiring Institute Report
This report provides metrics specific to applications, job postings and applicants, and helps organizations align their hiring goals with long-term, strategic objectives.
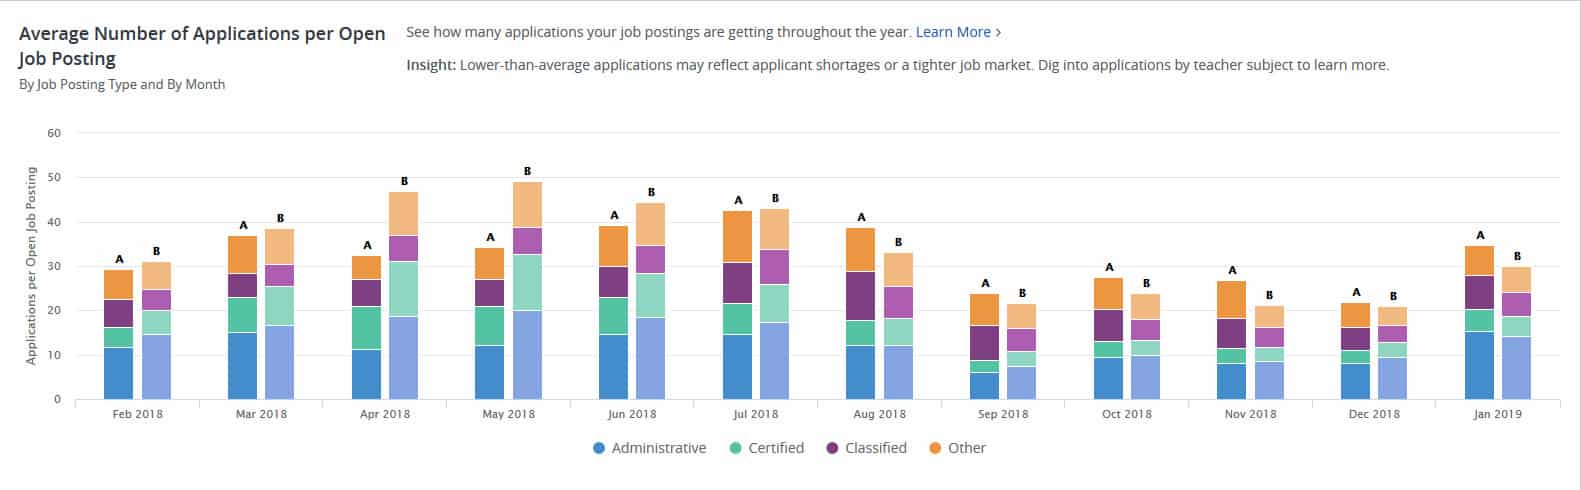
Average Number of Applications
Identify the average number of applications submitted, per open job posting, over the past twelve months. You can explore this by job posting type (administrative, certified, classified and other) or teacher subject. Like all metrics in the Institute Report, your organization’s data is shown in comparison to the benchmark.
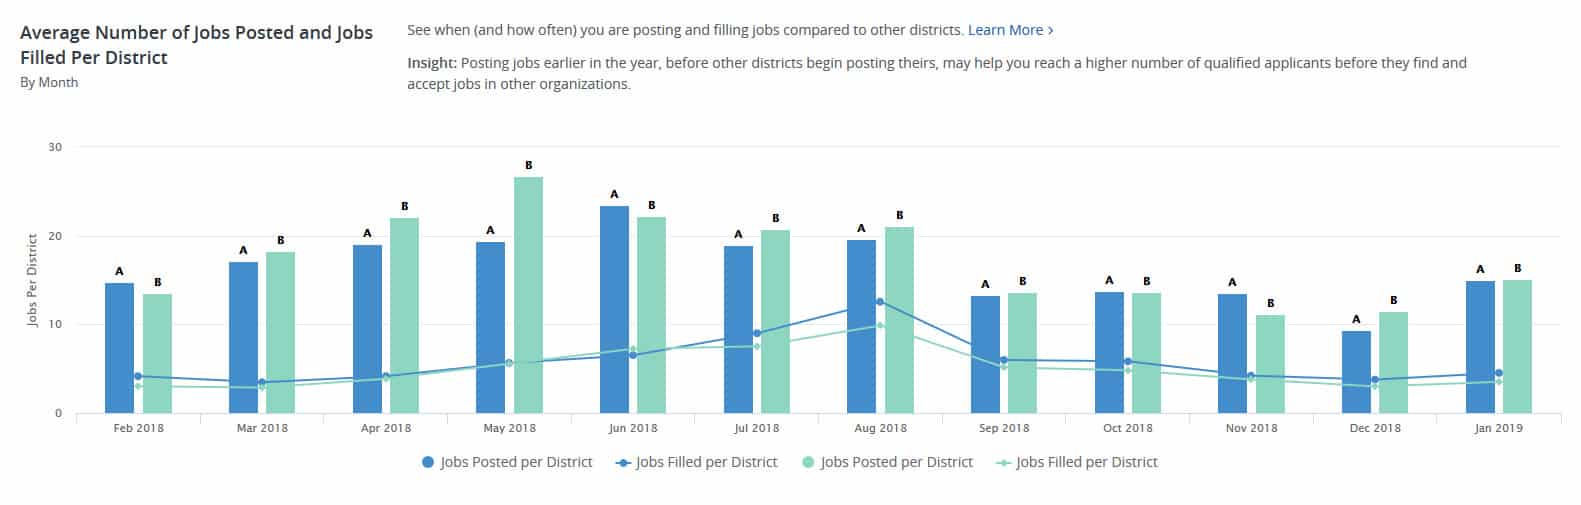
Average Number of Jobs Posted
Explore the average number of jobs posted and filled over the past twelve months to see when most jobs are posted, as well as when most jobs are filled. By comparing your data to the benchmark, you gain insight into whether your district’s hiring timeline tends to be later than others, putting your recruitment efforts at a disadvantage. You can also determine which teaching positions have the most posted jobs, and how that compares to the number of applications received.
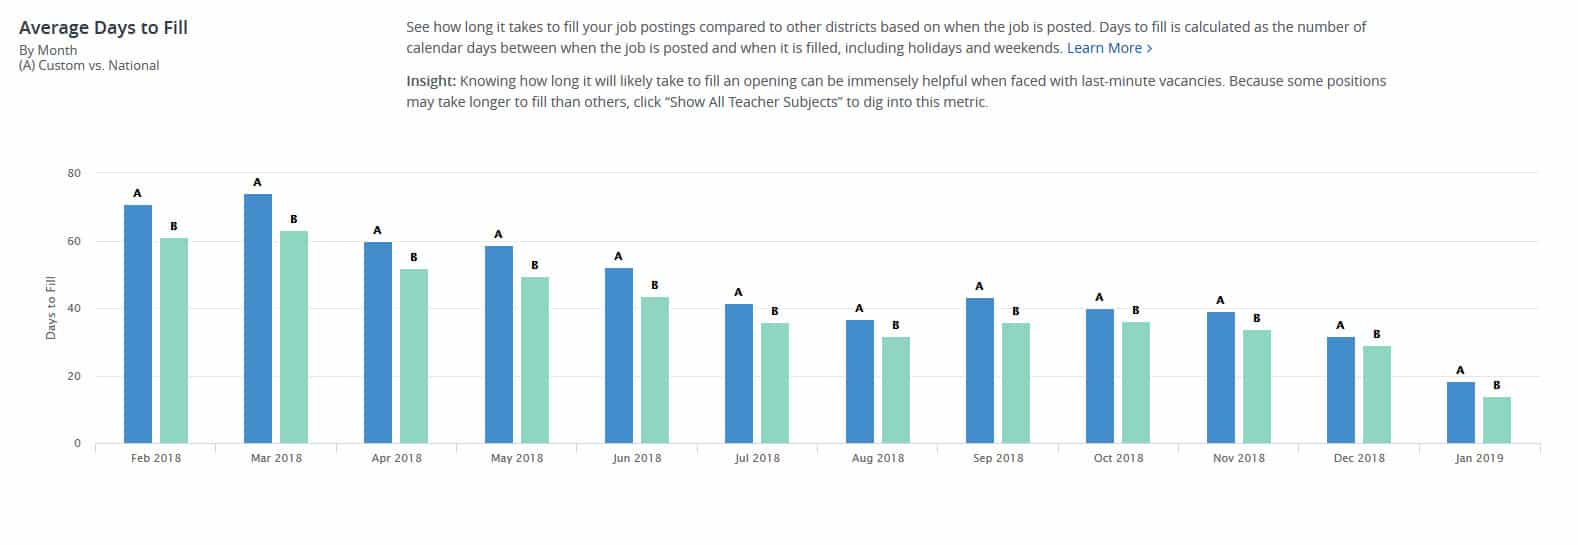
Average Days to Fill
Determine how long it takes to fill posted teaching positions. You might learn that certain teaching positions take a longer time to fill, or that posting certain jobs earlier in the year may lessen the time needed to find and hire a qualified candidate.
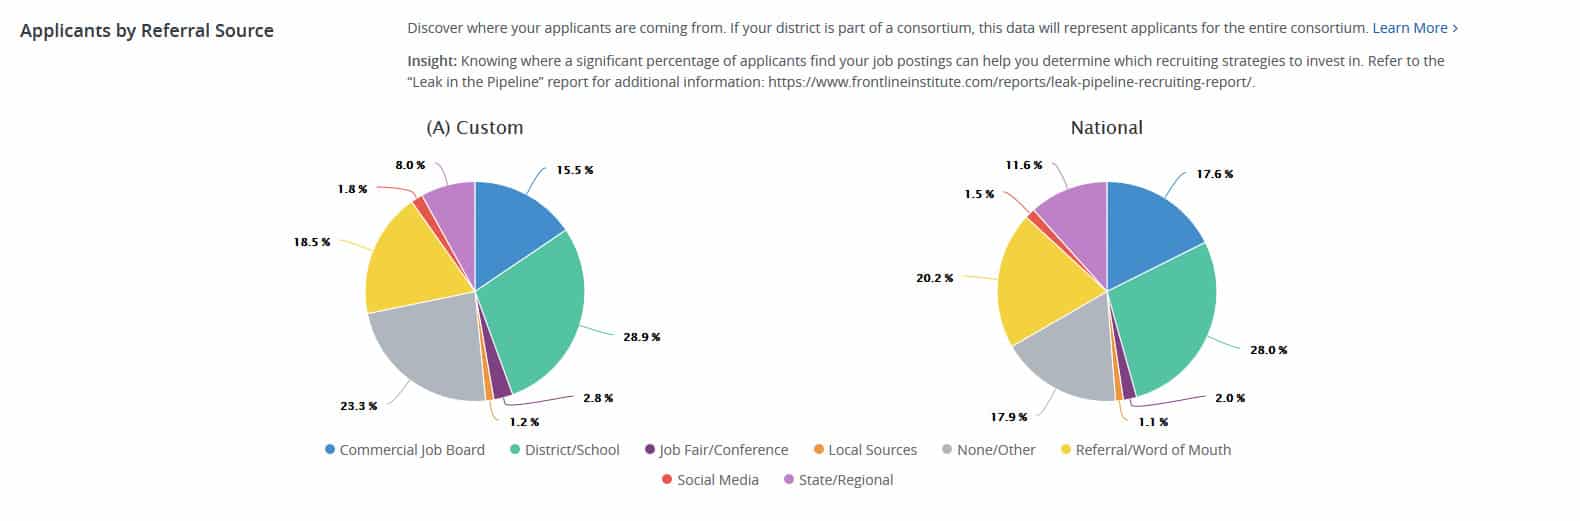
Applicants by Referral Source
Uncover where your applicants are coming from, and how your referral source channels compare to where other districts find applicants. This can inform your recruitment strategy and ensure that you are putting your resources toward the most effective referral sources. In addition, you can see at a glance which referral sources lead to the most hired applicants — empowering you to refine your strategy even further. Just be sure to take precautions against unconscious bias that may influence hiring decisions based on how applicants find your district.
Additional Resources
For more on the disparity between applicants’ and hired applicants’ referral sources, see our report:A Leak in the Pipeline
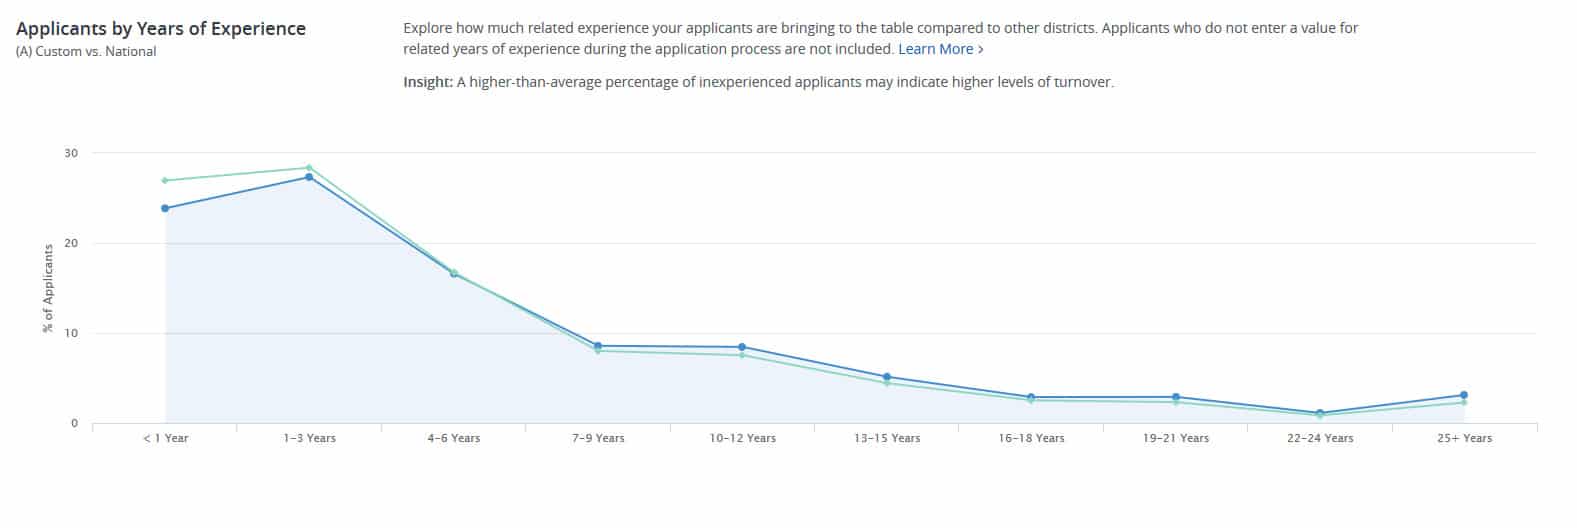
Applicants by Years of Experience
See how experienced your applicants are in comparison to other districts’ applicant pools. You can expand this to see how the average years of experience differ between different teacher subjects and identify trends in your recruiting and hiring.
Learn more about how Frontline Education is embedding data-driven insights into our school administration software.
Elizabeth Combs began her career as an elementary school teacher and Director of Administrative and Instructional Technology at Patchogue-Medford School District before moving to Imperial Software Systems, a professional learning services company, where she eventually served as President. She then held positions at My Learning Plan Inc. as President and Chief Strategy Officer. With degrees from the State University of New York at Geneseo and Teachers College, Columbia University, Ms. Combs has a passion for leveraging technology to support educator growth and over two decades of experience developing solutions rooted in best practices for professional development.