Analytics By Chris Ryan, Sr Analytics Advisor and Travis Zander CPA, Sr Analytics Advisor, on 12/20/2021
Since March 2020, Congress has passed three stimulus bills that provided nearly $200 billion to the Elementary and Secondary School Emergency Relief (ESSER) Fund. K-12 leaders now have access to an unprecedented amount of funding, which is undoubtedly needed given the financial constraints school districts faced pre-pandemic. However, the influx of funding plus the pace in which it was distributed created significant challenges. Many leaders are expressing concerns about how they should put the money to best use today, and to lay the groundwork for a long-term strategy that positions their districts to maintain strong fiscal accountability. This becomes the fundamental challenge — the funding is temporary but many school district needs are increasingly permanent.
According to a recent survey conducted by EdWeek Market Brief, 2021, K-12 leaders state that their biggest challenge when it comes to deciding how to spend federal stimulus dollars is that they have high-priority, ongoing expenses — such as salaries and benefits — that they are prevented from using with these funds. That concern is followed by uncertainty around how this flow of money meshes with other federal funding. School districts need and want to remain compliant, but that becomes a complex task as ESSER spending guidance evolves.
Education leaders will need to take a strategic approach to ensure they are leveraging all of the funding sources available to them, including the stimulus funding, in an appropriate and effective manner. Data and Analytics can be a powerful tool in helping school leaders navigate this new territory by supporting comprehensive development, implementation planning and reporting for transparency and compliance all with the purpose of providing the most effective fiscal approach in support of an organization’s strategic goals.
This research brief will highlight specific approaches using easy-to-use tools that leverage comparative and financial analytics to assist school officials in understanding the most effective uses of ESSER funds given an organization’s goals and needs.
How to Inform Financial Strategy Using Comparative Analytics
Comparative Analytics leverage consistent, historic data points from multiple districts or schools. Prior performance data is typically submitted to the state education agency at the same time by all districts. The consistency in timing and submission criteria is important and unique to each state where comparative data is available. These data allow for the review and critical contrast of common district characteristics. By studying comparisons and identifying contrast, school leaders can develop deep understanding of contrasting performance and variations at the district and school level which may drive new management insights. District operation, staffing, enrollment, finance and student performance data sets can each reveal patterns and insight to drive new decisions.
The pandemic has changed how individuals in each role in a school district and school board operate. School leaders went from a mode of relative predictability to a general state of triage in just a few weeks. The calculated planning and artful crafting of messages to the school board and community members transformed into high-impact, short-term decisions and sustained uncertainty.
Budget decisions still had to be made and planning, albeit estimations and speculative, had to happen. Uncertainty of revenues, new expenses, staffing changes, and student enrollment have changed in some form for every district in the country. Now, the fundamentals of district operation and professional expertise of the administrative teams are as important as ever. Administrators are relying on comparative district data to help inform and accelerate decision-making.
This analytics approach now has a new purpose among teams as they communicate changes with their school boards. With the ability to discuss enrollment changes, staffing levels and revenues, relative to neighboring districts, administrators are finding new ways to increase transparency and include their community and school boards in the decision process.
“Incorporating Frontline’s Comparative Analytics solution into our strategic development process enabled us to develop the most effective and efficient budget overview,” said Dr. Kim Hawk, Chief Operating Officer of the Northwest School District, Missouri. “The data and visuals helped to convey a compelling story for staffing ratios at each of our school buildings and enabled multiple stakeholders to envision budget scenarios four to five years into the future.”
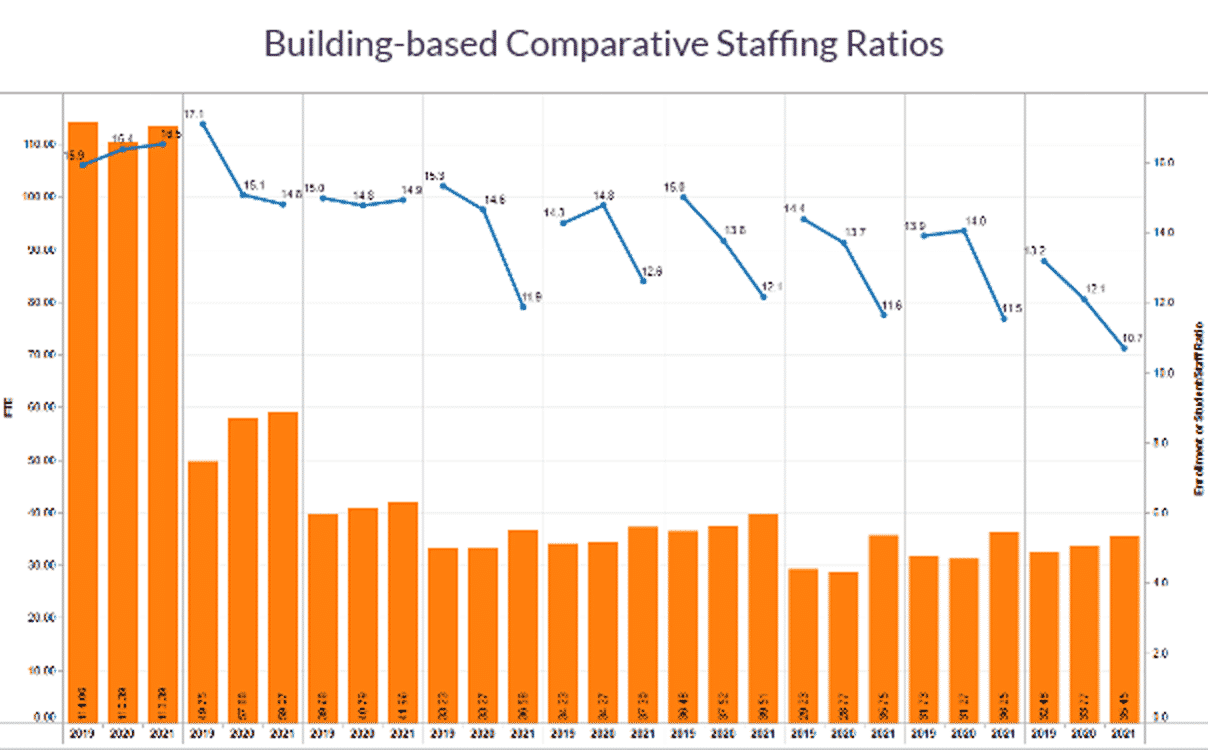
Figure 1: Staffing ratios visual is used to illustrate the challenge of declining student staff ratio (Blue Line). The ratio is the student enrollment of the school divided by the number of teachers at the school. In this example, with the significant student decline of the 20-21 school year, the ratio drops at each elementary school. (Most student enrollment loss was in the lower grades of schools.) Orange bars represent the number of teacher FTE for 2019, 2020 and 2021.
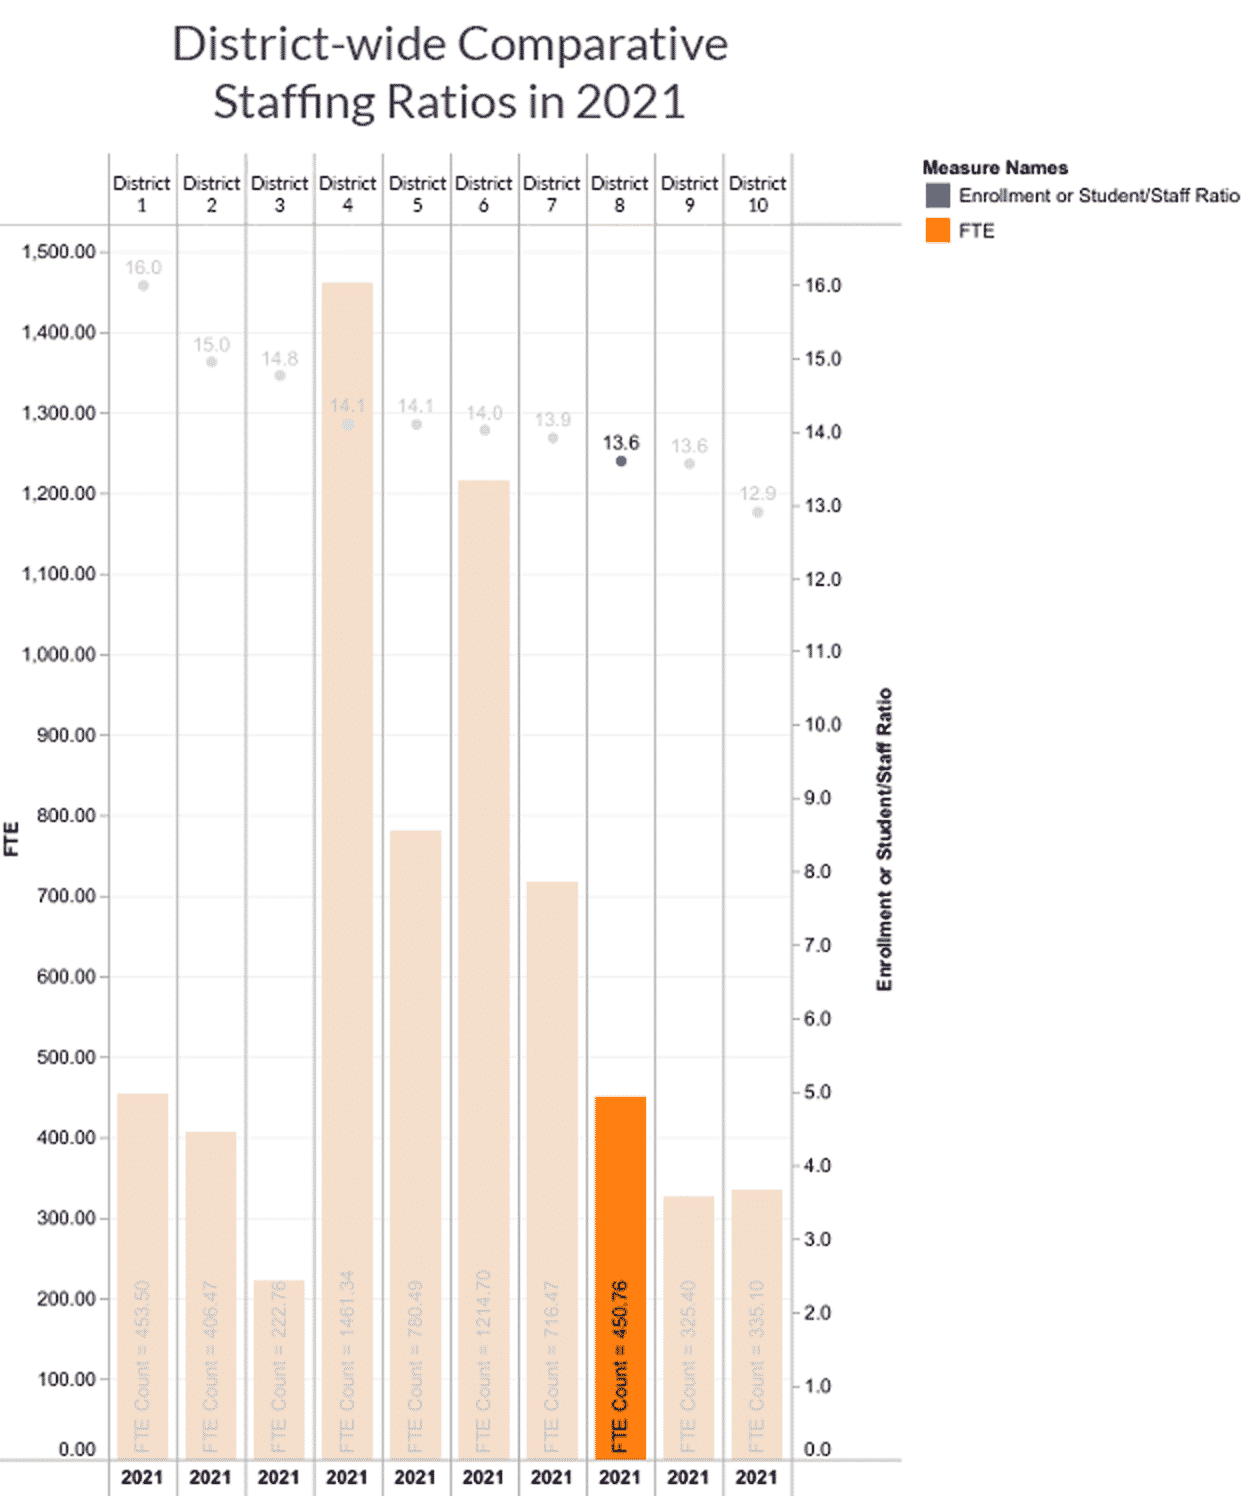
Figure 2: This visual shows staffing ratios of Northwest School District compared to peers. 13.6 is the staffing ratio for the school district. When further analyzing the individual schools within the district, this number can be used for district comparison.
In these situations, district and school comparative analysis can offer new revelations when contrasts become unavoidable. Perhaps because students have not returned as expected, or hiring plans developed prior to COVID-19 have not changed fast enough, the differences are now more apparent. New conversations will need to take place and should be influenced with today’s data in mind, potentially using data which is more current, such as detail from current finance software to focus on specific concerns.
Comparative analytics can help districts benchmark an organization’s performance on multiple metrics against those of their peers, groups of like districts or other K-12 organizations within their state to gain multiple perspectives as they consider their own strategies. The next step is to use that information to help inform the decisions of the district in concrete financial plans.
Developing Near-term and Strategic Plans Using Financial Analytics
ESSER funds are flowing into districts at unprecedented speed with specific spending deadlines. This increases the pressure on leaders to quickly determine how and when to spend the funds. However, taking time to align the funding source opportunities and limitations to short and long-term needs will result in more impactful spending and a high level of confidence related to the increased transparency and reporting requirements.
With increased funding comes increased requirements around financial transparency. Specifically, ARP ESSER requires a Use of Funds Plan that should be made available to the community. A next step includes clearly delineating the spending needs that are ongoing, to ensure there is no reliance on short-term funding. This provides clarity related to the near-term spending needs that can be reviewed against the funding source requirements. Finally, districts should be prepared for new compliance requirements that are attached to these dollars to ensure they do not have to revert money back after it has been spent.
Financial Transparency
Along with the additional funding, there are spending requirements and a need for increased transparency. Some example guiding questions include:
Did districts use funds to offset reductions in state aid dollars due to enrollment declines?
Did districts use funds to pay for more programming to stave off long term learning loss?
Did districts upgrade facilities with improved air filtration or cleaning materials due to the COVID-19 pandemic?
Financial Analytics solutions help districts efficiently build annual budgets and multi-year projections, model scenarios and future impacts to increase transparency and ensure their budget stays on track despite the impact of COVID-19.
Regardless of how the funds are used, it is important to communicate the spending plan to the community. Financial Analytics tools and the visuals they generate, allow for the tracking and reporting of financial spending trends and projections in an easy-to-consume format. (See Figure 3). By combining narratives with visuals, school district leaders can set a clear expectation for the community regarding the amount of revenue expected and where those dollars will flow across operations.
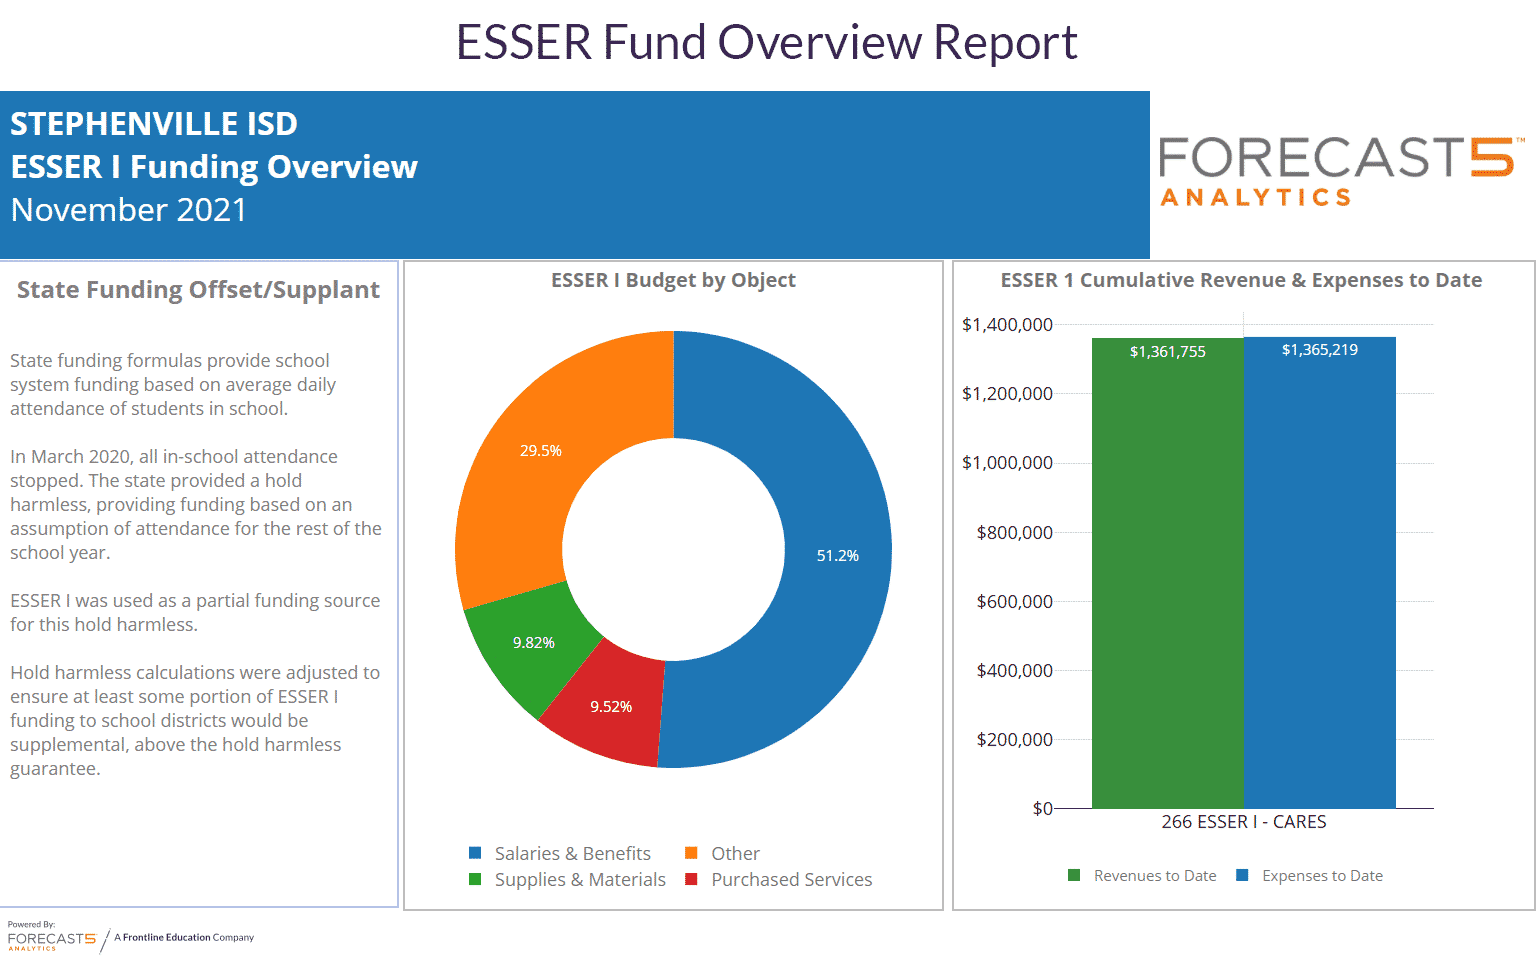
Figure 3: An example of a report shared with the district’s school board or published on a website. On the left pane, the district has a data-based narrative of the allowable funding uses. In the middle view, the district can see percentages of where funds are being spent across staffing, supplies and purchased services. The right pane graph illustrates the rate ESSER funds are being spent while monitoring the amount of remaining ESSER funds. Visual data like the charts above equip leaders with the tools and resources needed to communicate broadly and to ensure financial transparency.
Financial Planning
Leveraging these types of analytics and reviewing them monthly allows school officials and boards to be prepared for post-COVID funding and ensure they have sustainable plans as the stimulus spending deadlines draw nearer.
Nationally there has been a 3% decline in student enrollment in 2020-21 (NCES Blog | New Data Reveal Public School Enrollment Decreased 3 Percent in 2020–21 School Year). Additionally, there was a 4% decline in the birth rate nationwide from 2019-2020 which contributes to what analysts are calling a “Baby Bust” instead of a “Baby Boom” post pandemic. Many districts are expecting a rebound in enrollment; however, other critical factors such as disenrollment to home schooling or charter schooling may prevent that desired full rebound.
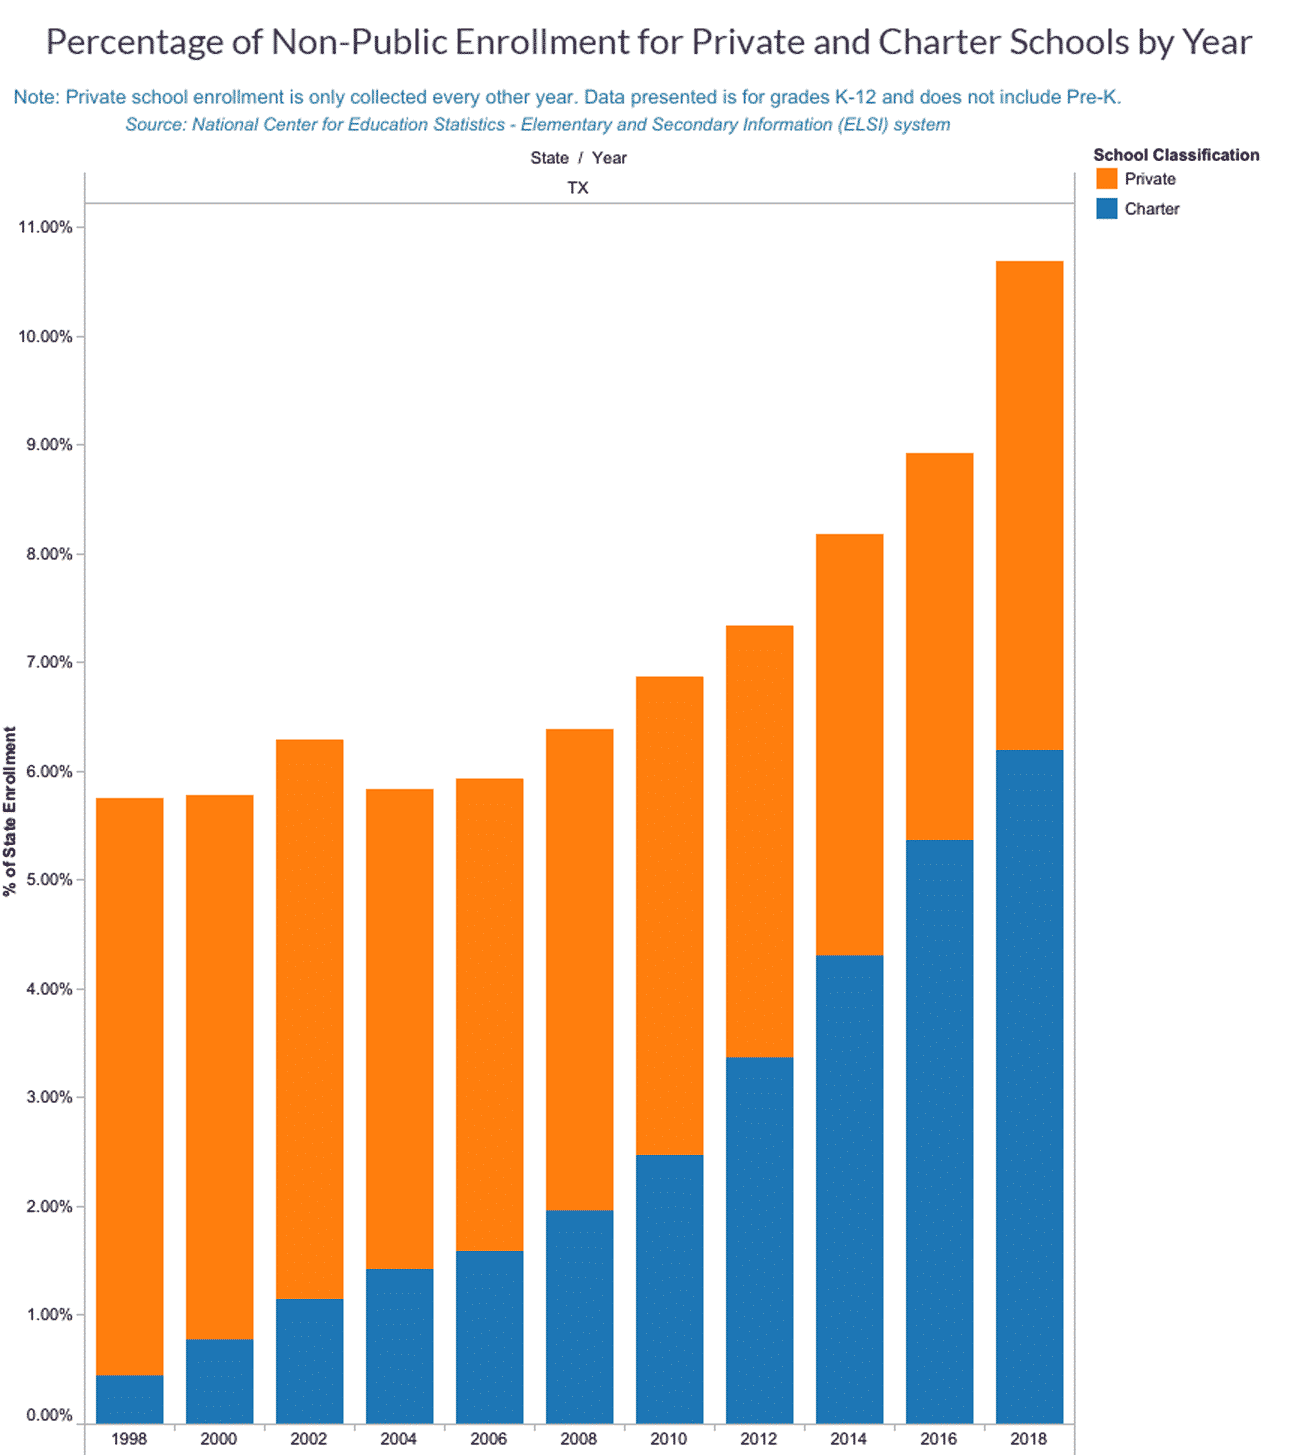
Figure 4: School districts in Texas have seen the percentage of private (orange bars) and charter (blue bars) school enrollment increase from below 6% of total enrollment to a total of close to 11% of statewide enrollment over a 10-year period.
As ESSER funds begin to deplete, schools may want to start to develop proactive communications plans to sunset programs that became more valuable during the pandemic but are no longer in high demand such as after-school tutoring. They may also want to reduce costs that were needed during the height of COVID-19 such as extra cleaning services, PPE and some personal devices.
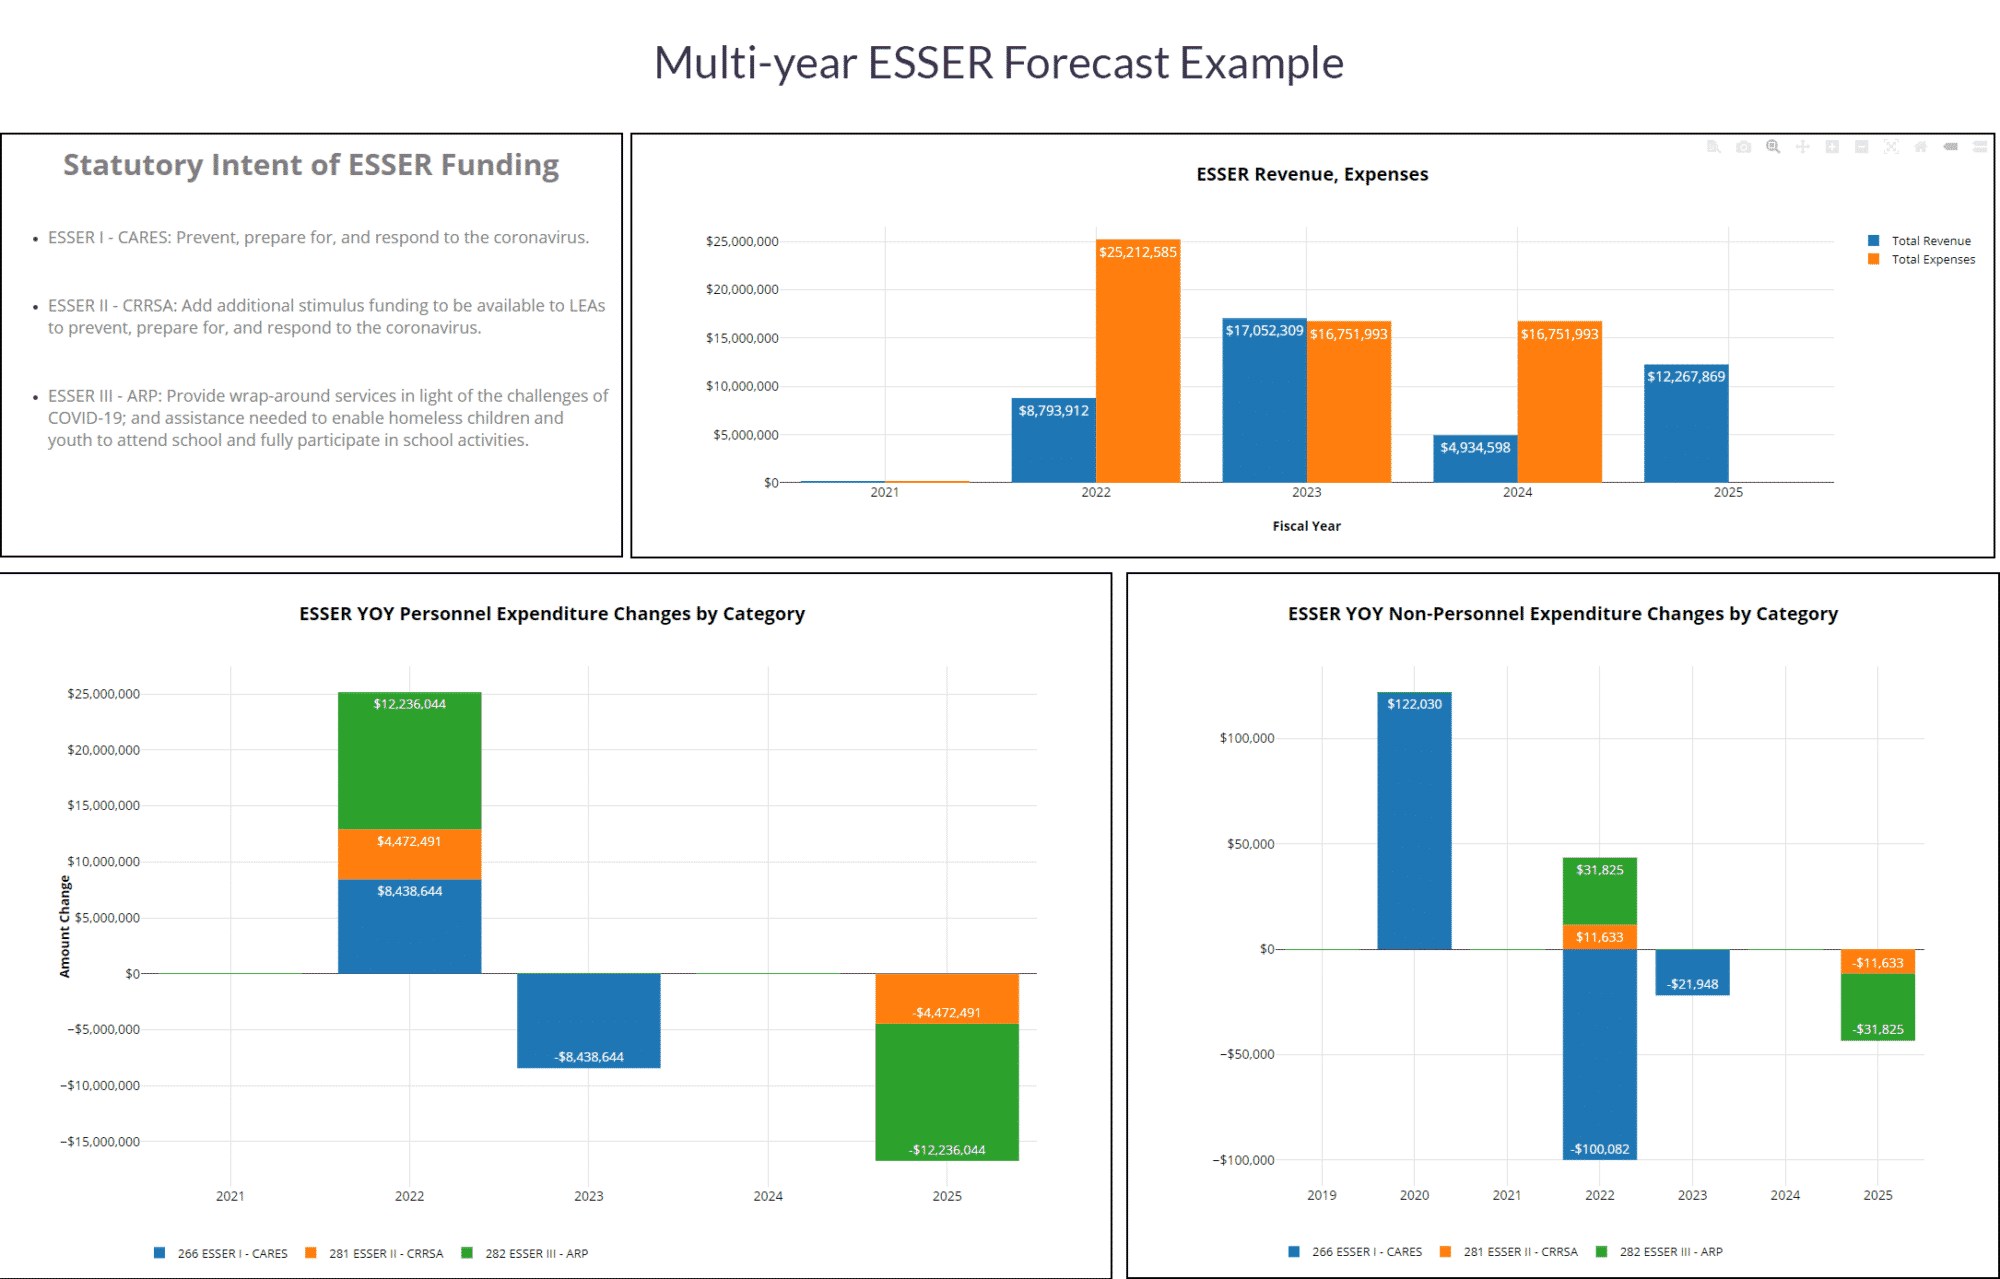
Figure 5: The ESSER Revenue and Expense graph shows the year’s revenues and the related planned expenses. The ESSER YOY Personnel Expenditure Change by Category graph shows the changes in staffing by individual grant. The final Graph of ESSER YOY Non-Personnel Expenditure Changes by Category graph highlights the non-staffing expense changes in a year-over-year format.
“Financial analytics have been instrumental in developing our district’s fiscal strategy. We activated a balanced approach in supplanting due to decline in attendance, while also supplementing in response to the diverse, unique needs that have developed. The ability to monitor the effectiveness of those new tactics, while also evaluating current operational efficiency to prepare for when ESSER funds end has been a critical tool in evaluating short term-effects and long-term financial impacts,” said Teri Hodges, Executive Director for Finance and Operations/CFO at Stephenville ISD, Texas. “Visuals have been incredibly helpful in communicating how we are spending ESSER dollars, and the forecasting tools enable us to toggle back and forth seamlessly to view immediate adjustments.”
Financial Compliance
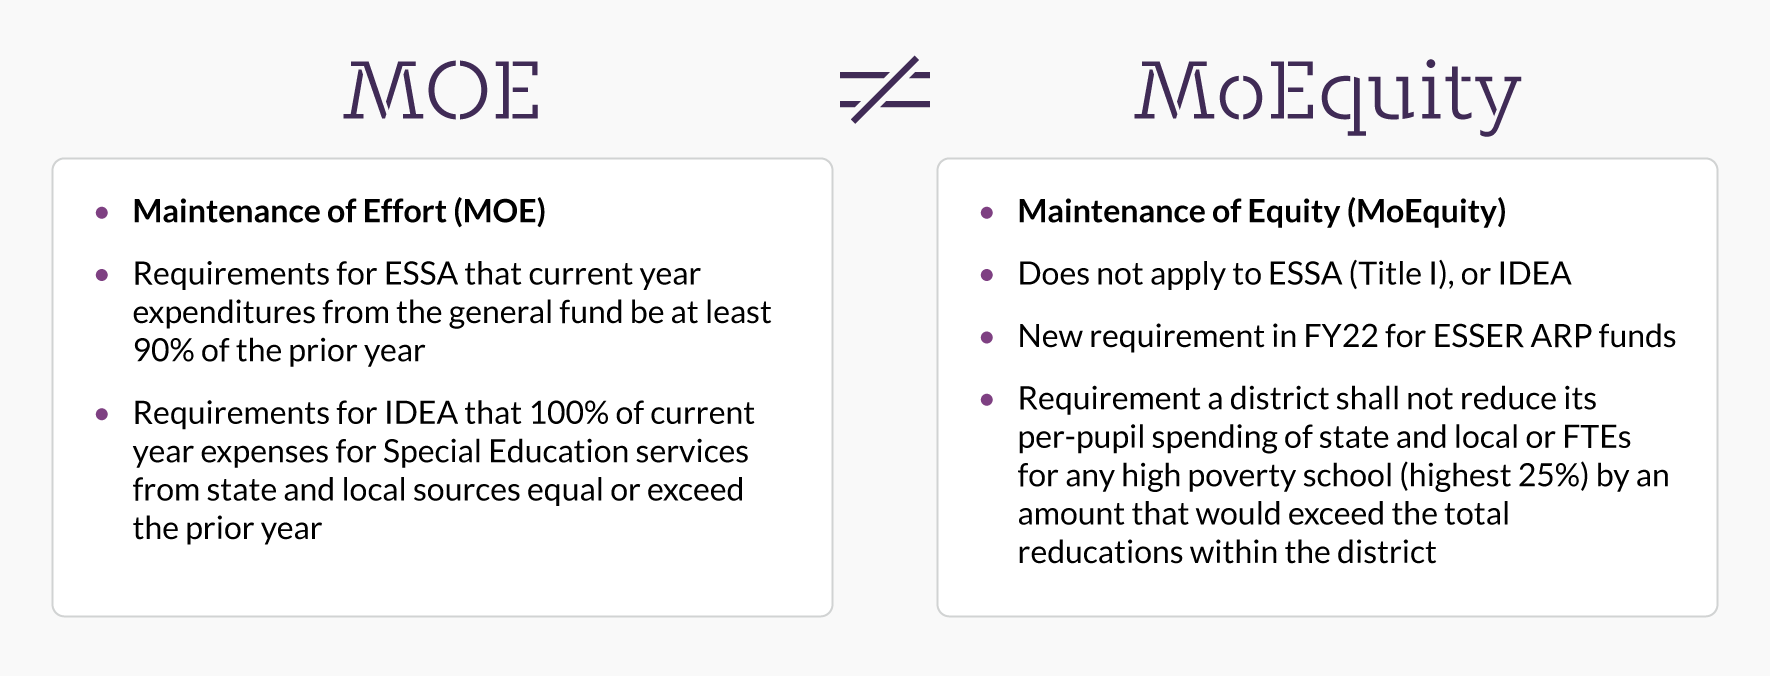
New compliance factors are an additional ESSER-related consideration for district leaders to understand and prepare in advance. The new funding may push some districts over the $750,000 federal award expenditures audit threshold. In this case, school districts will want to add extra vigilance to ensure that they are following the necessary policies and protocols to ensure regulatory compliance. Another area of consideration that pertains to ESSER III funds and the Cares Act is a new compliance requirement, Maintenance of Equity.
Maintenance of Equity (MoEquity) should not be confused with Maintenance of Effort. Maintenance of Effort is an existing requirement that LEAs maintain the level of state and local funds they spend to support federal programs from one year to the next, most commonly applied to IDEA and Title I. MoEquity is new requirement that a district shall not reduce its per-pupil spending of state and local or FTEs for any high poverty school (highest 25%) by an amount that would exceed the total reductions within the district.
Serves all students within each grade span with a single school.
LEA did not have an aggregate reduction in combined State and Local per-pupil funding in FY2022. However, districts should be cautious if their states decided to supplant state aid with federal dollars in FY2022.
School districts that meet this requirement can complete this form in Appendix B and submit it to the State Education Agency.
If a district experienced an “exceptional or uncontrollable circumstance” the school district’s LEA can submit documentation to the Department of State and the local SEA.
If a school district does not qualify for any of the exemption reasons, there are data and analytics tools and resources available to help support and ensure compliance.
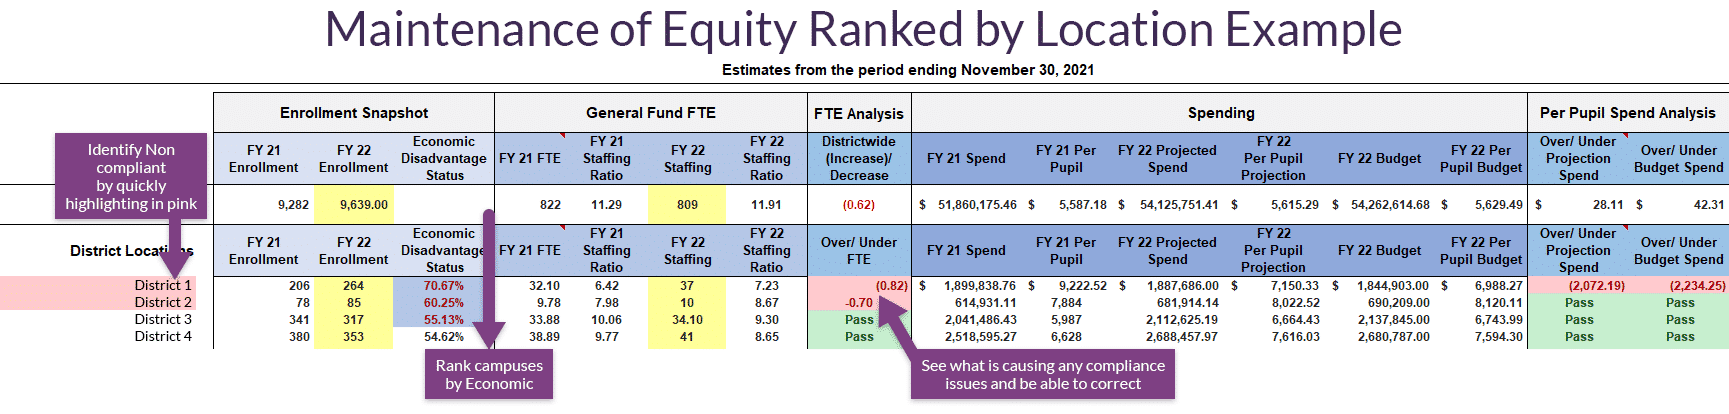
Figure 6: This example shows a tool that helps districts test for compliance around MoEquity. The tool will first rank the campuses in order of economic disadvantage status, then it compares staffing ratios between the prior year and current year, and the last component is a look at per-pupil spending between years. If any items are found non-compliant then it will highlight those campuses in pink for administrative review and correction.
Conclusion:
Having access to ESSER funding will certainly support districts as they continue to navigate the effects of the pandemic. As these large amounts of federal money come in, it is understandable that some districts may be hesitant to spend the money or not know where to begin to plan their spending efforts. Given the volume of the funds and the rapid-pace distribution, planning the use of these funds could easily be viewed as an insurmountable task. Utilizing data and analytics can help districts make informed decisions for their short-term needs as well as to develop long-term plans to maintain strong financial status and to make the best spending choices for the greatest needs of students. Data and analytics enable school leaders to communicate with confidence with their stakeholders, ensuring that funds are being spent appropriately to create impact and that proactive plans are in place for when the surplus funding expires.