ESSER and Equity: Leveraging Stimulus Funding to Increase Equitable Opportunities
Analytics By Dr. CyLynn Braswell, on 4/28/2022
The 2015 reauthorization of Every Student Succeeds Act, the nation’s long-standing legislation that serves as a commitment for equal opportunities for all students, came with a myriad solutions funded across a variety of title funds. Combined with the major influx of ESSER relief funds since the onset of COVID-19, and the inadequate and complex funding process for public education, school leaders are now facing new levels of complication. Even if the short-term frustrations around federal, state, and local education budgets are removed, education systems from coast-to-coast are taxed with a variety of challenges around informed decision-making.
Prior to the COVID-19 global pandemic, schools were already working through redesigning their organizations to dismantle opportunity gaps for students — a term that should evolve from “learning gaps,” which implies a deficit on the part of the student, rather than “opportunity gaps” which focuses on a strategic approach that targets need to ensure equity — while providing at minimum, adequate and differentiated professional learning for their staff. Indeed, schools were already addressing a variety of challenges, such as a talent pipeline shortage and a shrinking pool of veteran teachers. Over the last 24 months, schools across the country have continued to hear the struggles of their most seasoned teachers, many of whom are considering leaving or retiring from teaching. A recent research brief from the University of Arkansas, College of Education and Health Professions, cited that 34% of teachers ages 55 and older were considering leaving the profession compared to 23% for all respondents (Zamarro, Camp, Fuchsman, & McGee, 2021).
Although there is this new influx of funding for schools at the federal and state levels, more dollars do not always mean more qualified staff. Yet, schools have been privy to the research over the years that shows a positive relationship between teacher experience and student performance, especially those students who are most marginalized within the educational system (Ladd & Sorenson, 2017). However, the public narrative centers around the notion that some teachers are considering leaving the profession. (Graves & Hasselquist, 2021). Four years prior to the COVID-19 pandemic the U.S. Department of Education (2016) showed that at least two-thirds of states were experiencing teacher shortages.
This white paper will highlight the role analytics can play in assisting school leaders in identifying students who need the most support, establish strategies to position students and teachers for success, and ensure equitable opportunities for all. Data and analytics tools that can help with this work are eligible for ESSER funding.
Using Student Analytics to Mitigate Opportunity Gaps
Districts are grappling with growing financial pressures and an influx of funding that can be difficult to spend, all while working to redesign their organizations, meet community expectations, and find clarity amongst the “next best” solution. Public sentiment suggests that these factors are contributing to the teacher shortage and creating a concern that school leaders will lose high-quality staff.
With so many expectations pre-COVID, juggling data-informed decisions around students and staff became even more difficult during the height of the pandemic. School districts were often data rich but lacking the tools to turn that data into actionable insights. With the right analytics, school districts can find clarity in seeking questions that focus on the organization, while helping school administrators find ways to quickly locate students who need strategic interventions. Using multiple points within a system, such as course grades, discipline records, and attendance tracking, school leaders can quickly identify students who are disengaging from the school community.
DEFINITION OF STUDENT ANALYTICS
Student analytics consolidate disparate datasets to help districts measure student performance, determine opportunity gaps, assess equity, and improve student achievement outcomes, regardless of the learning environment.
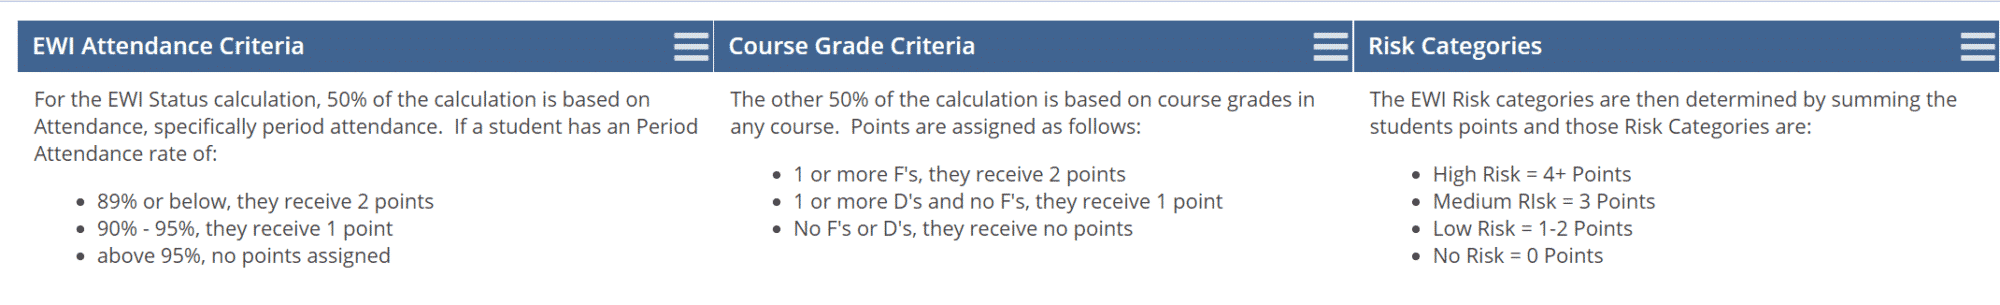
Balancing organizational culture with a need for student improvement requires a reflective look at the data. However, with so many metrics creating overwhelming amounts of information, it is difficult to determine where to start the assessment. Assessing systems made within the confines of the organization is always a good starting point. Records of attendance, grades, and discipline are all created and facilitated through various roles and identities within an organization. A school district can view these systems and take a critical look at pervasive deficit ideology while developing professional learning that “strengthens pedagogical skills and broader equity skills” (Gorski, 2018, p. 18). Figure 1 provides an example of an Early Warning System (EWS).
Figure 1: Early Warning System
Figure 1: This dashboard illustrates early warning signs for secondary students grades 6-12 and their breakdown from No Risk to High Risk by percentage of the entire grade level.
Combining a set of metrics around these three areas (attendance, grades, and discipline) to create a system of early warning indicators can support school leaders in identifying disparities across the organization, grade level, school buildings, to serve those most marginalized within the organization. Many school officials hold themselves accountable with Results Driven Accountability (RDA), which focuses on improving the performance of students with special needs, and the data they monitor becomes paramount. When a district begins to see their students through the EWS lens, the work of ensuring that their most seasoned staff are interacting with students becomes an organizational goal. Decision makers might ask what access do students who historically are at high-risk of disengaging with school have access to veteran staff?
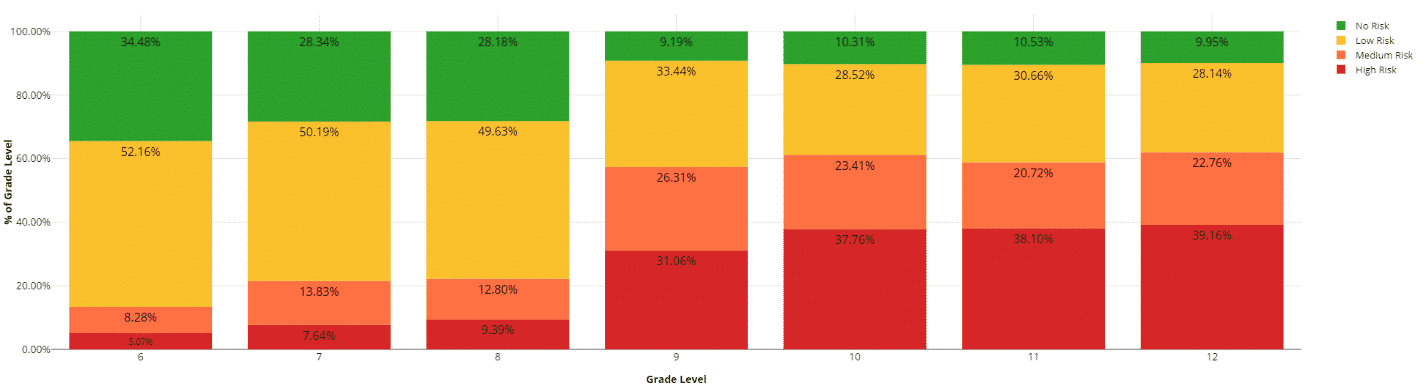
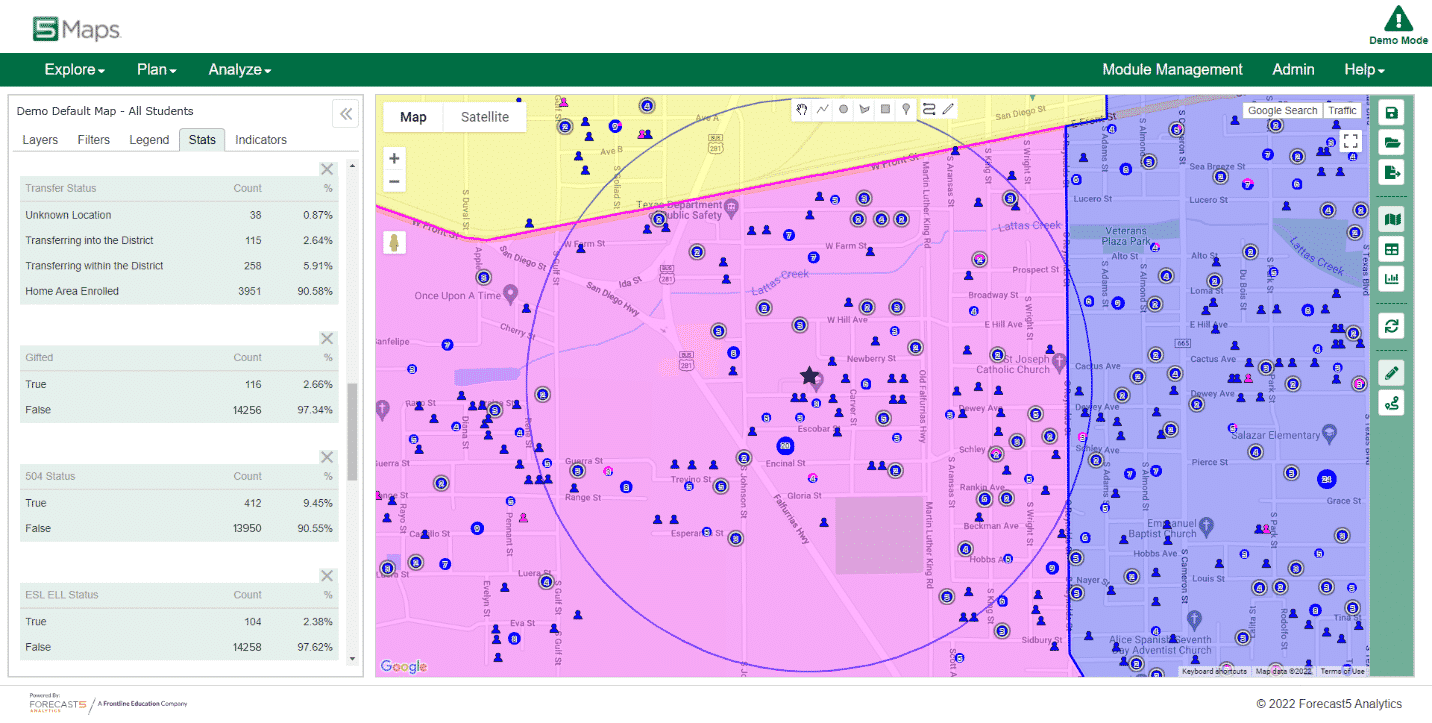
Figure 2: Special Education Services and Grade Distribution Dashboard
Figure 2: This visual shows how a district can monitor students who receive special education services and how they are performing by grade level and their breakdown of grade distribution.
As visualized in Figure 2, in the initial stages of this view in the Student Analytics tool, a district can quickly measure disproportionality amongst their most marginalized students. Those districts that want to dig deeper may even include a more granular set of metrics to see students who receive a variety of wrap-around services and the communities in which they live.
The strength of a school building might be found in data where those students who are marginalized are not generally readily compared to their peers through deficits, but talents. Strength can come when a building or district Professional Learning Community (PLC) convenes over data and sees where a group of students is succeeding. This opportunity allows for this PLC to then examine best practices and see how patterns of instructional strength can make lasting change over time. Analyzing timeline trends to discern the best interventions allows for a team, building, or district to see potential professional learning investments. This becomes increasingly important when new-to-the-profession teachers need additional professional learning. Mid-career to veteran teachers have the greatest impact on student performance. Ensuring who receives additional services and are engaging with those staff is more than good practice, it is a matter of intentionally staffing to reduce opportunity gaps.
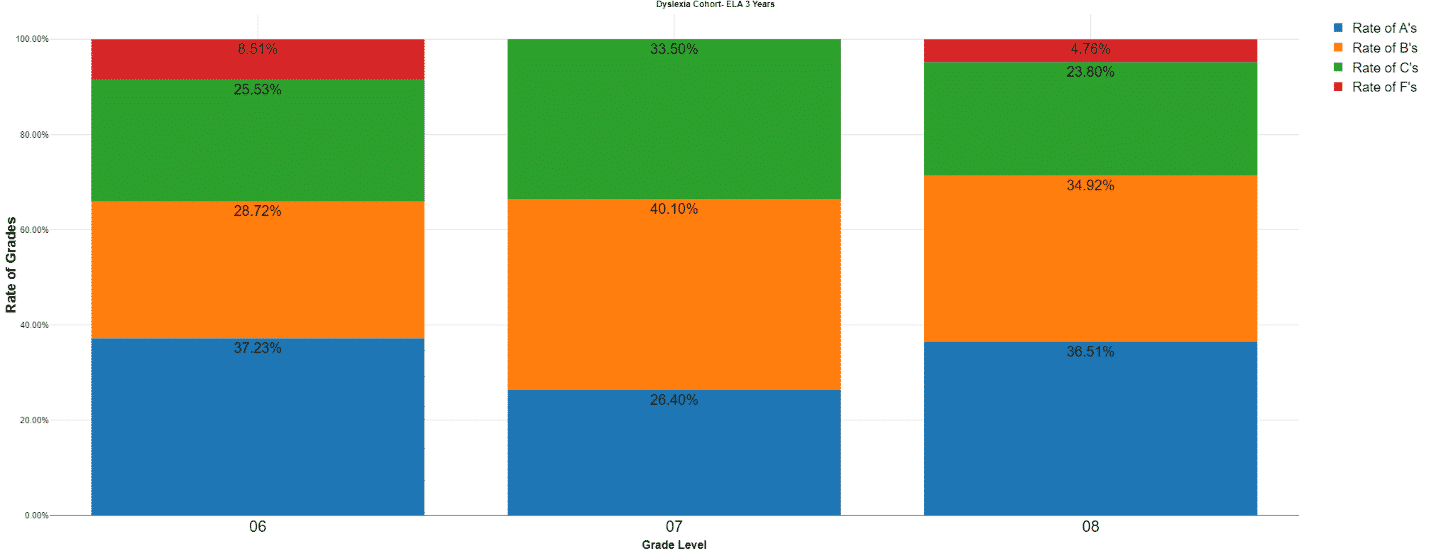
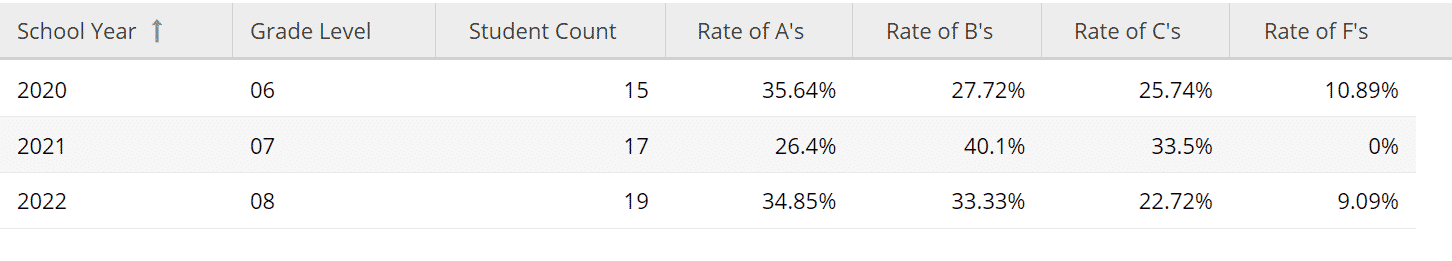
Figure 3: Dyslexia Services and Grade Distribution
Figure 3: This visual shows a cohort of students who receive Dyslexia services over a three-year period and grade distribution in ELA courses while receiving targeted services.
When intentionally addressing equity and working to understand cultures, classism, racism, sexism, ableism, and marginalization, a systematic approach is essential. Seeking equity for students who receive services means addressing needs that are more complex in the larger society. Historically, within some organizations, this has created a segregation between staffing and opportunities. Districts that are focused on addressing this type of opportunity use a variety of analytics to assess the concentration of teachers with fewer years of experience who may have a larger concentration of students who should receive additional services. See Figure 3.
Leveraging Location Analytics to Reduce Barriers to Equity
As a district begins to address the needs of student and staff interactions, it is important to remember that students experiencing success do not live solely within the confines of the school building.
Taking a first look at where students live may help to maximize a school district’s ability to strategically place additional services in the community. By partnering with local community organizations, districts can discover and develop relationships that can continue to grow and evolve over time. In an effort not to make assumptions about community needs, it is best practice to seek advice from community organizers about the services the community needs and how partnerships will help all stakeholders achieve in a district. Without understanding the geography of where students live, school leaders and stakeholders may find they are at a deficit in serving their students.
Districts who are focused on equity understand where their students live and what access they have to opportunities within their communities. Asset-based opportunities where communities can engage around students can have a positive impact. Effective engagement assists families in supporting their child’s learning while remaining accessible (Maya Whitaker, Public School Equity). Using analytics to understand where and when to offer engagement opportunities is just as essential as providing content that supports the family. See Figure 4.
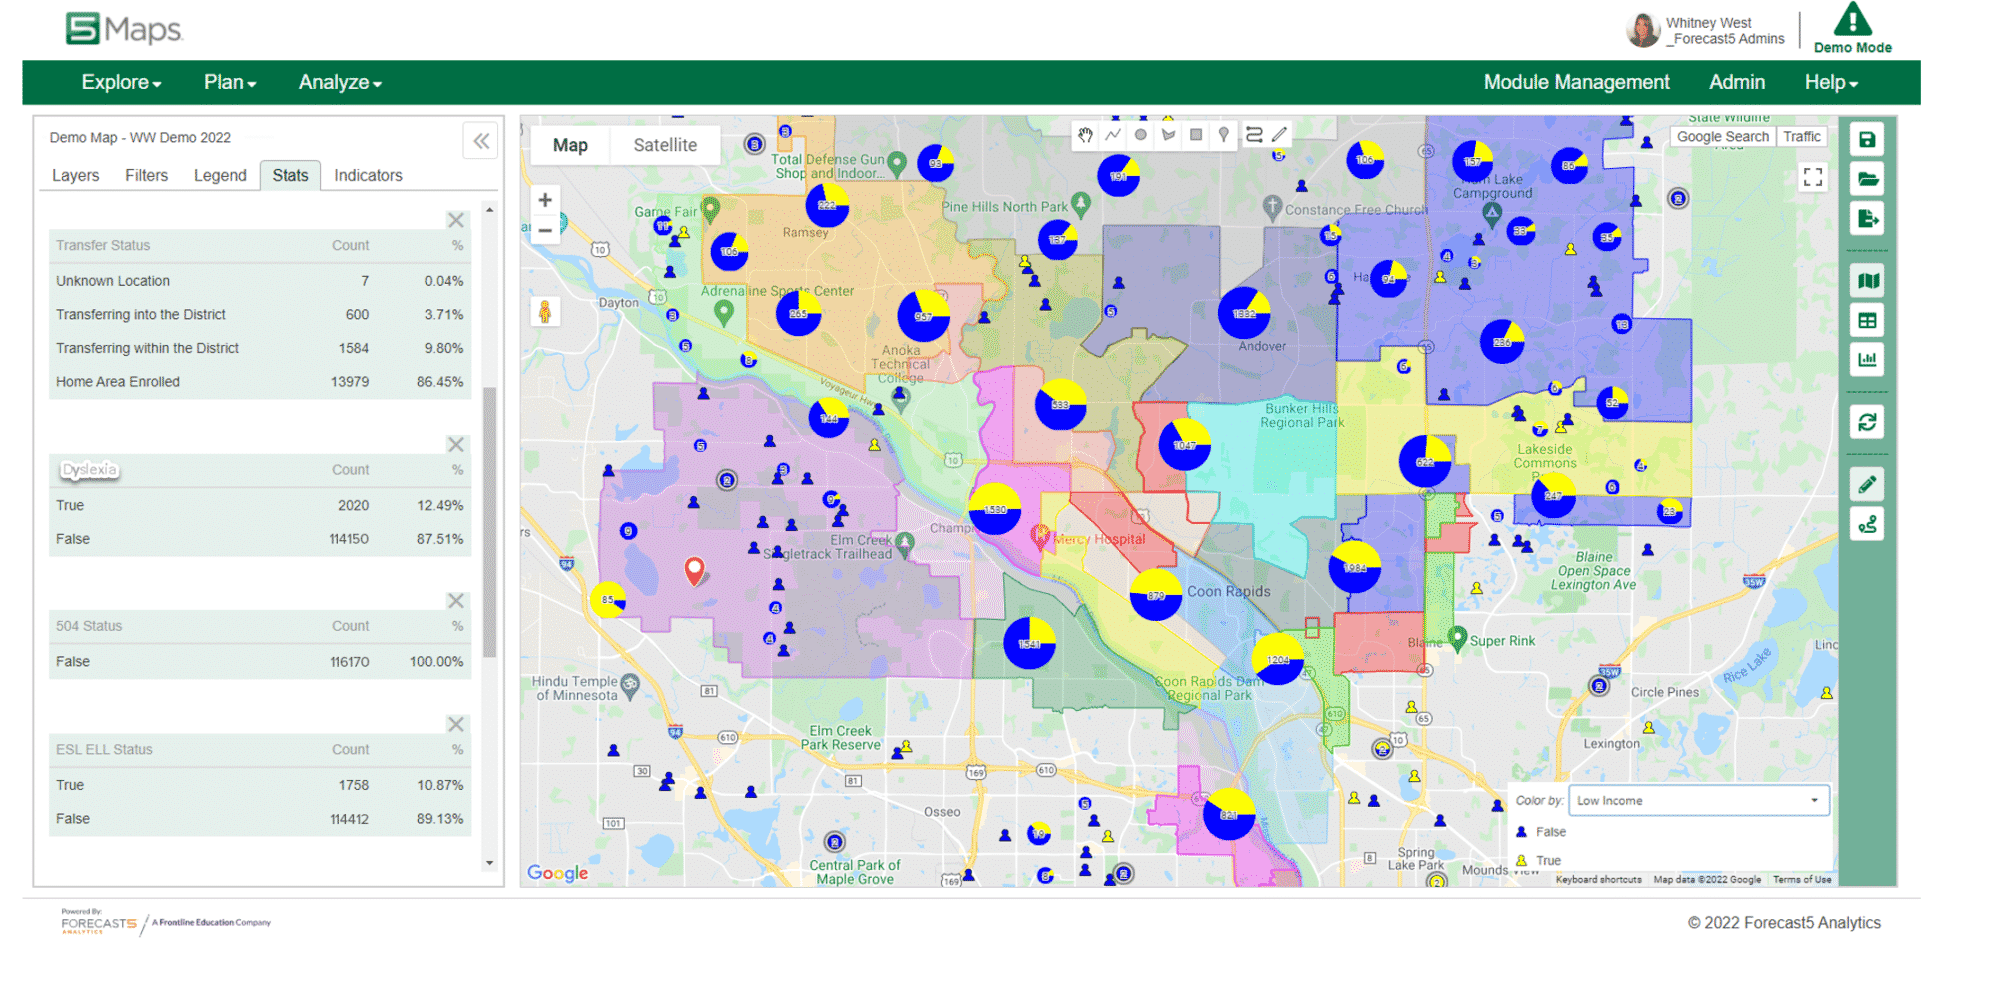
Figure 4: Student Proximity to Community Services and School Building
Figure 4: This visual shows demo data of the location of students who meet certain demographic criterion and their home proximity to local community services and their school building.
DEFINITION OF LOCATION ANALYTICS
Location analytics enable districts to evaluate boundaries, determine optimal service locations, and narrow the “digital divide.”
A case study on how analytics can make quick work of resources
One school district in Texas sought a familial approach post-pandemic to get services to families more efficiently. By designing a family grouping code through their registration process, this district was able to use that attribute in both student and location analytics. Some districts may want to host food service for non-school days, additional parent training, back-to-school services, broadband stations — the list is endless. By using both student and location analytics, this school district was able to concentrate their resources while using data-informed practices to pinpoint the most strategic options and locations for wrap-around services. This district was able to see which of their students who are economically marginalized resided in areas that did not have broadband by family. The district could then provide hotspots for families with multiple children. This multi-measure approach allowed the district to reduce their time in getting service to students, while being more strategic with their resources. See Figure 5.
Figure 5: Students Receiving Dyslexia Services with Access to Broadband
Figure 5: This map represents demo data. The circles represent the concentration (clustering) of all students who live in the area. The yellow portion of the circle represents the percentage of students in that cluster who receive dyslexia services. The shaded colors on the map are the areas where broadband is or is not available.
When the Student Analytics Lab report was built to show entire families at-risk, this district was able to see how families with multiple children in the district might be better served. One story highlighted that a family with seven students who were all chronically absent, across three school buildings, had interactions with 41 teachers. This gave pause when the district asked questions about messaging, email, and contacting parents whose students are struggling. Are these interactions all positive? Were these interactions potentially alienating this family from the district? The first step for this group was to convene the three school principals to see how they might better serve this family. Using location analytics, the district could assess if there were potential barriers for this family in transportation, food, and health care.
“Implementing family grouping has enabled NISD to strategically support sibling and family groups as efficiently as possible,” said Julie Meek, Director of Data Services, Northwest ISD, Texas. “We’ve been able to target areas of need such as WiFi access, food availability, attendance monitoring, and parental involvement in order to assist our students and families more effectively.”
Questions that a district or building-level leadership team might ask themselves to support ensuring equity
In these turbulent times, considering the variety of business decisions that need to be made, a marriage of analytics around student performance, student needs, teacher experience, and requisite professional learning must be formed to answer strategic questions.
Example guiding questions:
What are the average years of teacher experience per school building, grade level, and subject area?
Of those teachers with less than five years’ experience, who are the students they serve, and what services must those students receive?
Are schools serving students who are economically marginalized disproportionately staffed with inexperienced teachers?
Are the district’s most novice teachers assigned to classrooms where students’ needs are the most diverse and student prior achievement is low?
Where do our students live and is food accessible in those places?
Is health care close by where students from where students who are economically marginalized reside?
What community resources, such as libraries and community centers, are available to students?
What professional learning practices are intentionally focused on ensuring new-to-the-profession teachers are receiving differentiated learning experiences based on the students they serve?
Is there a disproportionate number of experienced staff not working with students who receive wrap-around services?
Do experienced staff have professional learning opportunities that are designed to address the needs of students who receive services?
Answering these questions can aid a district in designing a system of monitoring students who receive services and tracking the results of those services throughout the year. Ending the year with an analysis of student performance over time, as the district implemented professional learning designed to address the needs of the students and teachers, can ensure that school leaders are making the most effective use of ESSER funding.
Conclusion:
With so much focus on the here and now of spending ESSER dollars, it is imperative that a three- and five-year plan be established for how the initial onset of these dollars will be spent and if those expenditures can be sustained 3-5 years in the future. When pursuing student achievement, organizations should intentionally use funds for solutions that can help in the short term, but are also built for long-term, sustainable use and effectiveness. The organizational structure of the school and staff need to be clear before continually focusing on adding staff to solve “the right now” problem. Using data to understand students most marginalized within a school is not about looking for students as a problem to be solved, rather it is about examining the organization’s strengths that can be replicated and the organization’s weakness that can be mitigated.
Using data to understand students most marginalized within a school is not about looking for students as a problem to be solved, rather it is about examining the organization’s strengths that can be replicated and the organization’s weakness that can be mitigated.
When designing systems around student and location analytics, it is not enough to focus on a singular point of assessment data to determine organizational success. Although tempting, people are not a singular data point, and schools are in the most complex of businesses — the people business. A letter grade rating from the state or a national ranking is only as good as the stakeholders who experience the organization in its totality. Building capacity within a community is an effort that requires long-term strategies, sustained efforts, and the ability to make data-informed decisions. And at the heart of each strategy, effort, or data point, it is essential to prioritize the needs of the young people served.
References
Gorski, P. (2018). Reaching and teaching students in poverty: strategies for erasing the opportunity gap. New York: Teacher College Press.
Graves, N., & Hasselquist, L. (2021). A case study of CTE teacher retention: transitioning from mid-career to veteran teacher status. Journal of Family and Consumer Sciences Education, 1-12.
Ladd, H., & Sorenson, L. (2017). Returns to teacher experience: student achievement and motivation in middle school. Education Finance and Policy, 241-279.
Solari, C. D., Morris, S., Shivji, A., de Souza, T., Khadduri, J., & Culhane, D. (2016). The 2015 Annual Homelessness Assessment Report to Congress, Part 2. Washington D.C.: The United States Department of Housing and Urban Development.
Whitaker, M. (2022). Public School Equity: Education leadership for justice. New York: W.W. Norton & Company, Inc.
Zamarro, G., Camp, A., Fuchsman, D., & McGee, J. (2021). Understanding how COVID-19 has changed teachers changes of remaining in the classroom. Fayetteville : University of Arkansas & Saint Louis University.